Averages from a bar chart
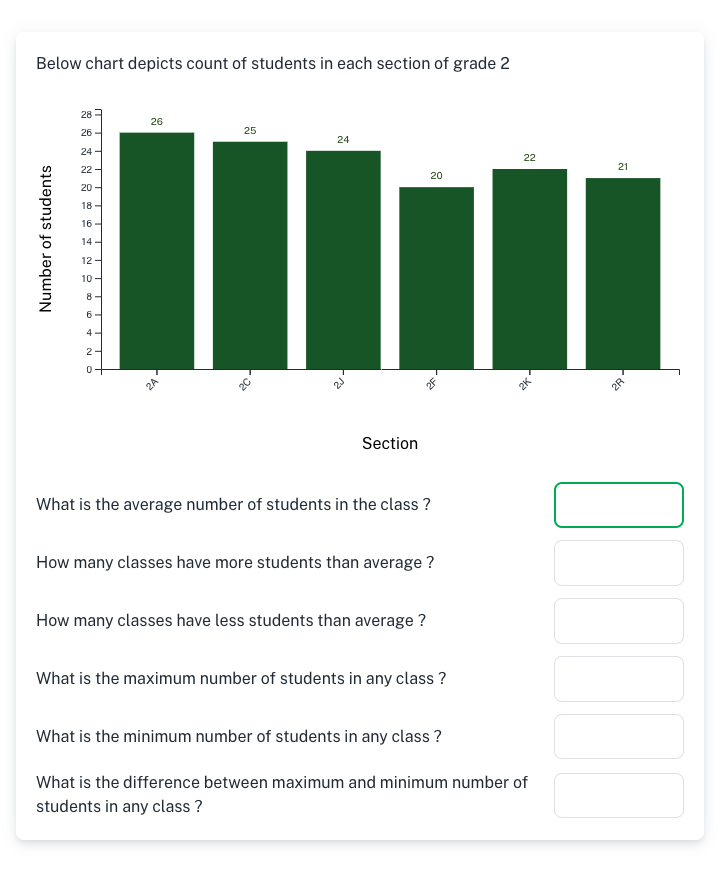
A bar chart shows a set of values, such as the number of students in each class. The student works out the average, then how many are above and below it, the largest and smallest values, and the difference between them.
Six questions about one chart, so the student reads the same data in several ways.
Numbers&Me is free. Sign up to practise more, or set it as homework in under a minute, and it marks itself.
What changes each time
- Heights, class sizes and more
- New values every time
- Six questions per chart
More data, graphs and probability practice
- Sort and count (Grade 1)
- Bar graphs (Grade 2)
- Reading pictographs (Grade 3)
- Line plots (Grade 3)
- Pie charts with percentages (Grade 4)
- Pie charts with numbers (Grade 4)
- Venn diagram problems (Grade 4)
- Probability with coins and dice (Grade 4)
- Does the coin remember? (Grade 4)
- Probability of picking two (Grade 5)
- True, false or no information (Grade 5)